Panele KPI live
Zënia, ADR, RevPAR, GOPPAR, ALOS, marrja, të ardhurat F&B, mbulimi mesatar, të rifreskuara live ndërsa platforma regjistron çdo transaksion.
KPI live nëpër gjithë pronën, zënia, ADR, RevPAR, të ardhurat F&B, përzierja e segmenteve, përzierja e kanaleve, kurbat e marrjes. Ndërto panele të personalizuara, planifiko eksporte dhe qëndro gati për ditën kur Bee AI fillon t'u përgjigjet pyetjeve për të gjitha këto.
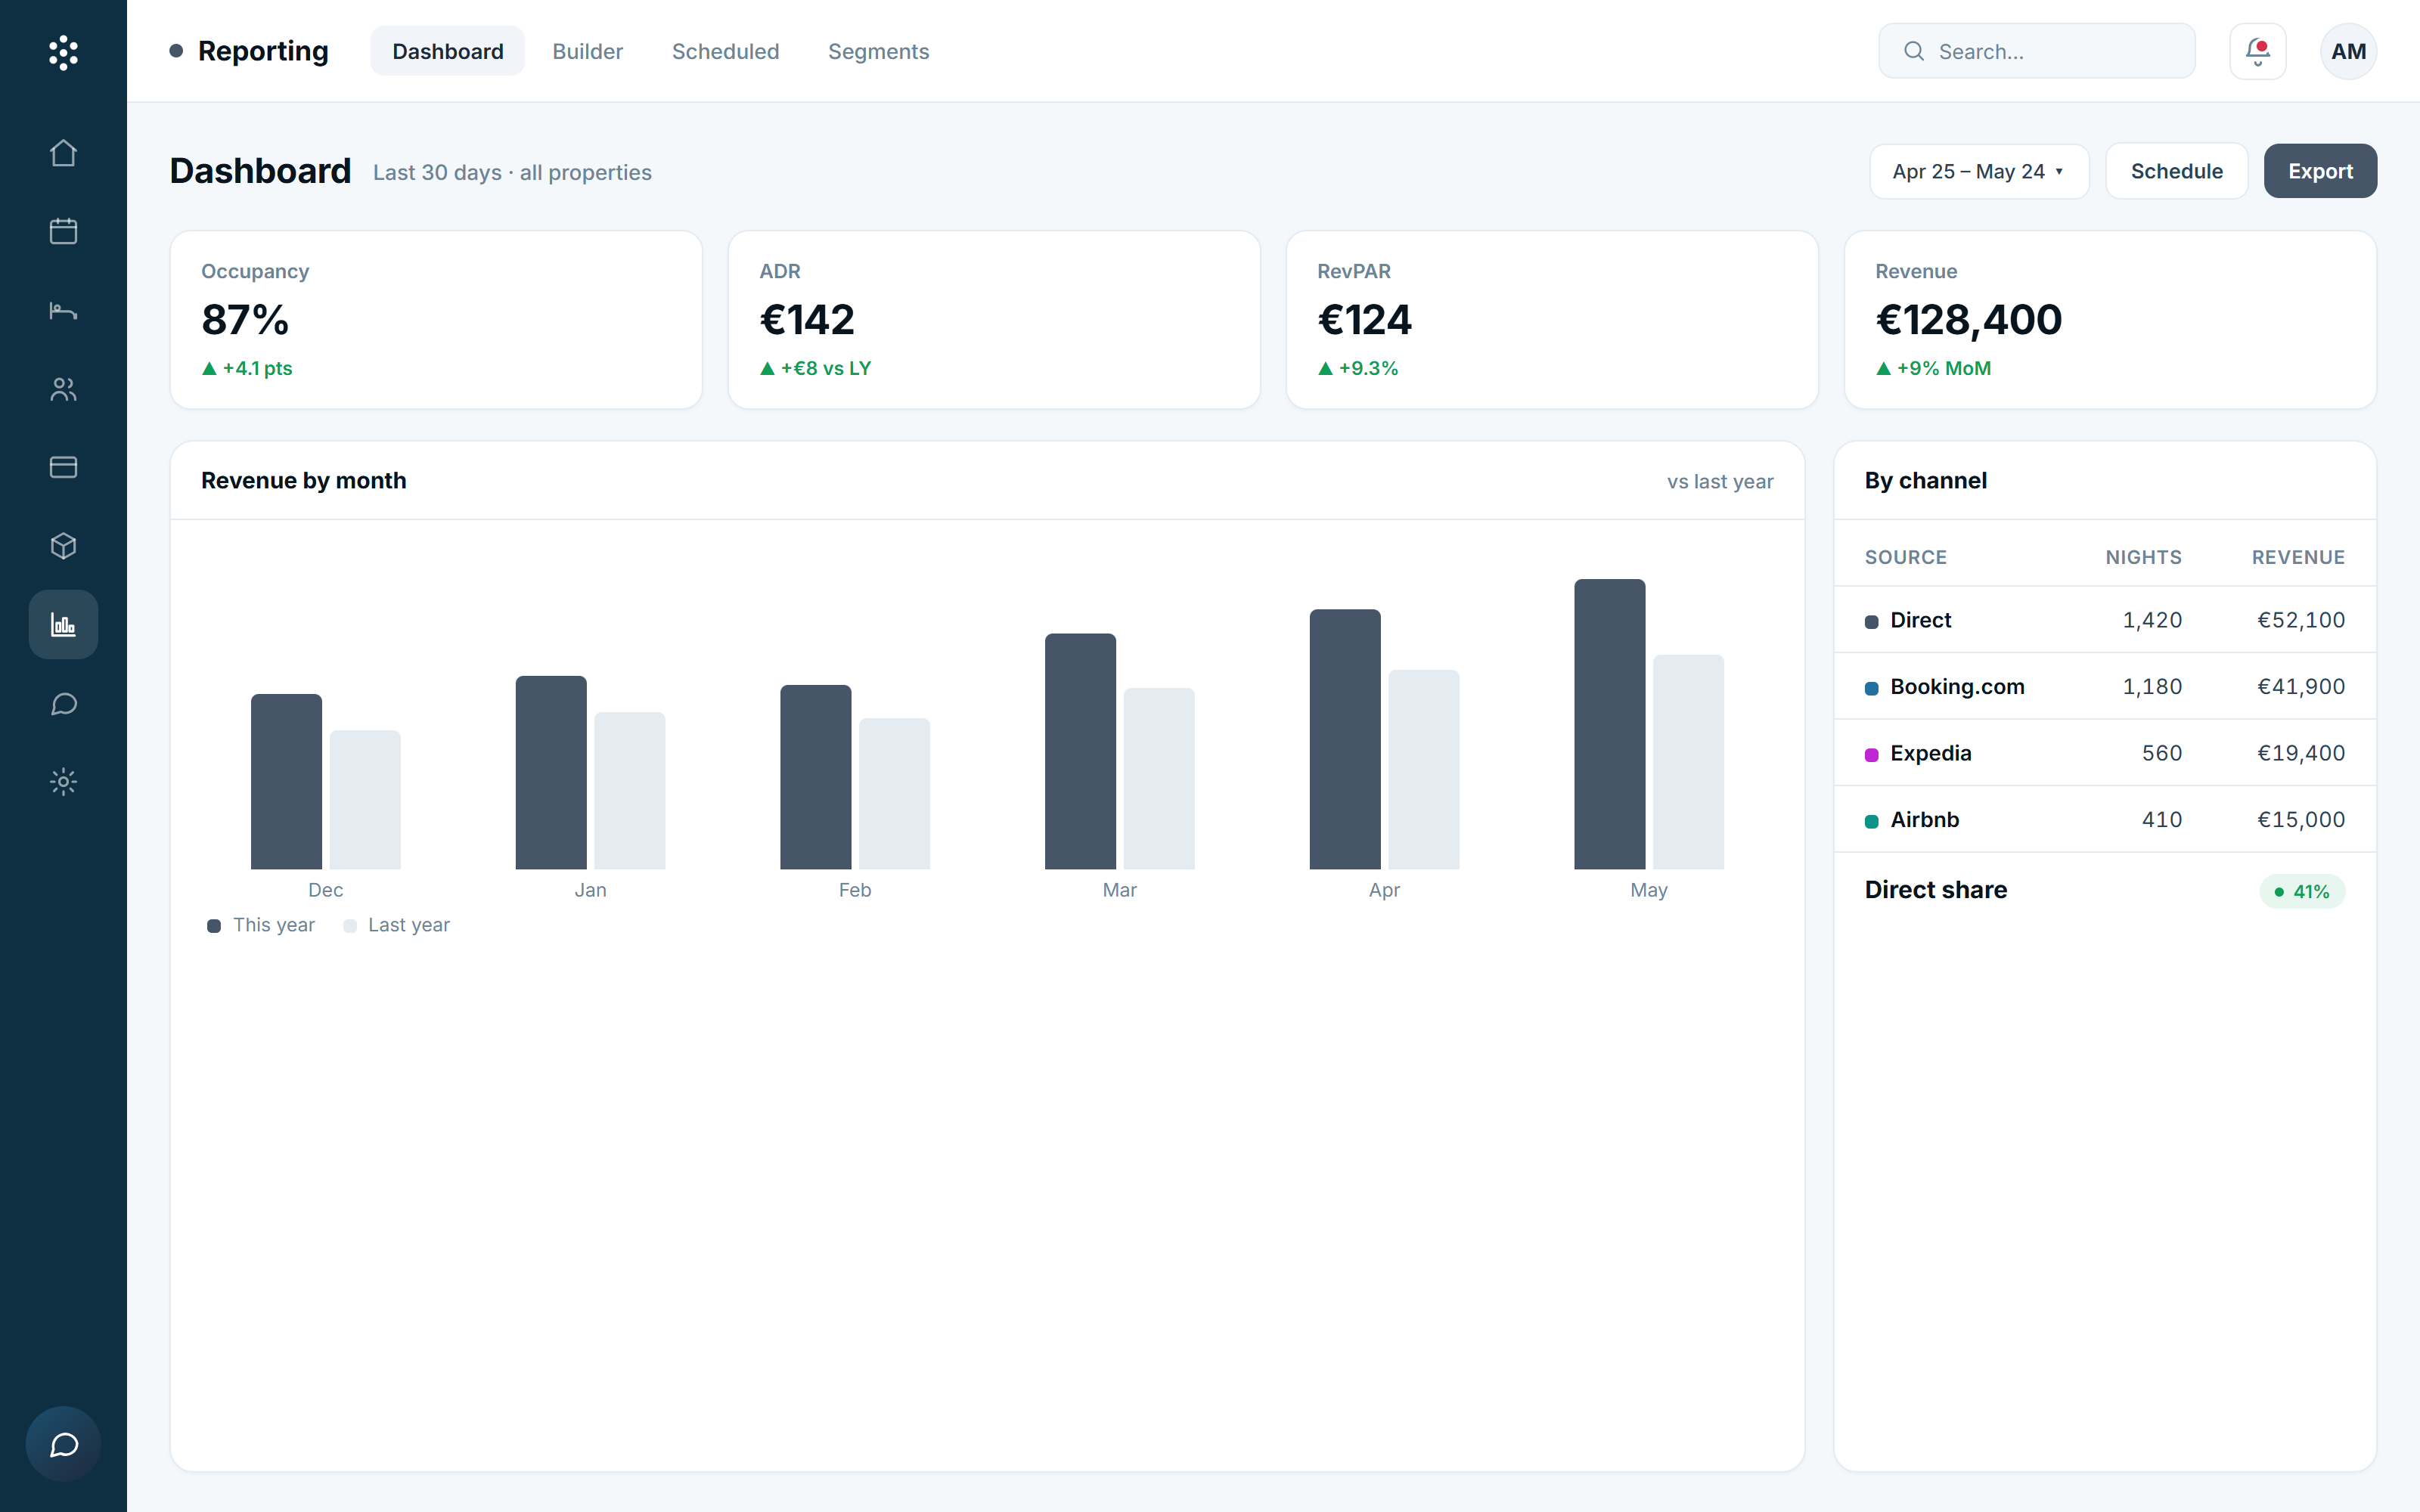
I ndërtuar për operatorin që ka nevojë për numrin e duhur në orën 8 të mëngjesit, eksportin e duhur në 17:00 dhe rrëfimin e duhur për pronarin të Hënën. Live, i personalizueshëm, i planifikuar dhe gati-AI kur ti je gati.
Zënia, ADR, RevPAR, GOPPAR, ALOS, marrja, të ardhurat F&B, mbulimi mesatar, të rifreskuara live ndërsa platforma regjistron çdo transaksion.
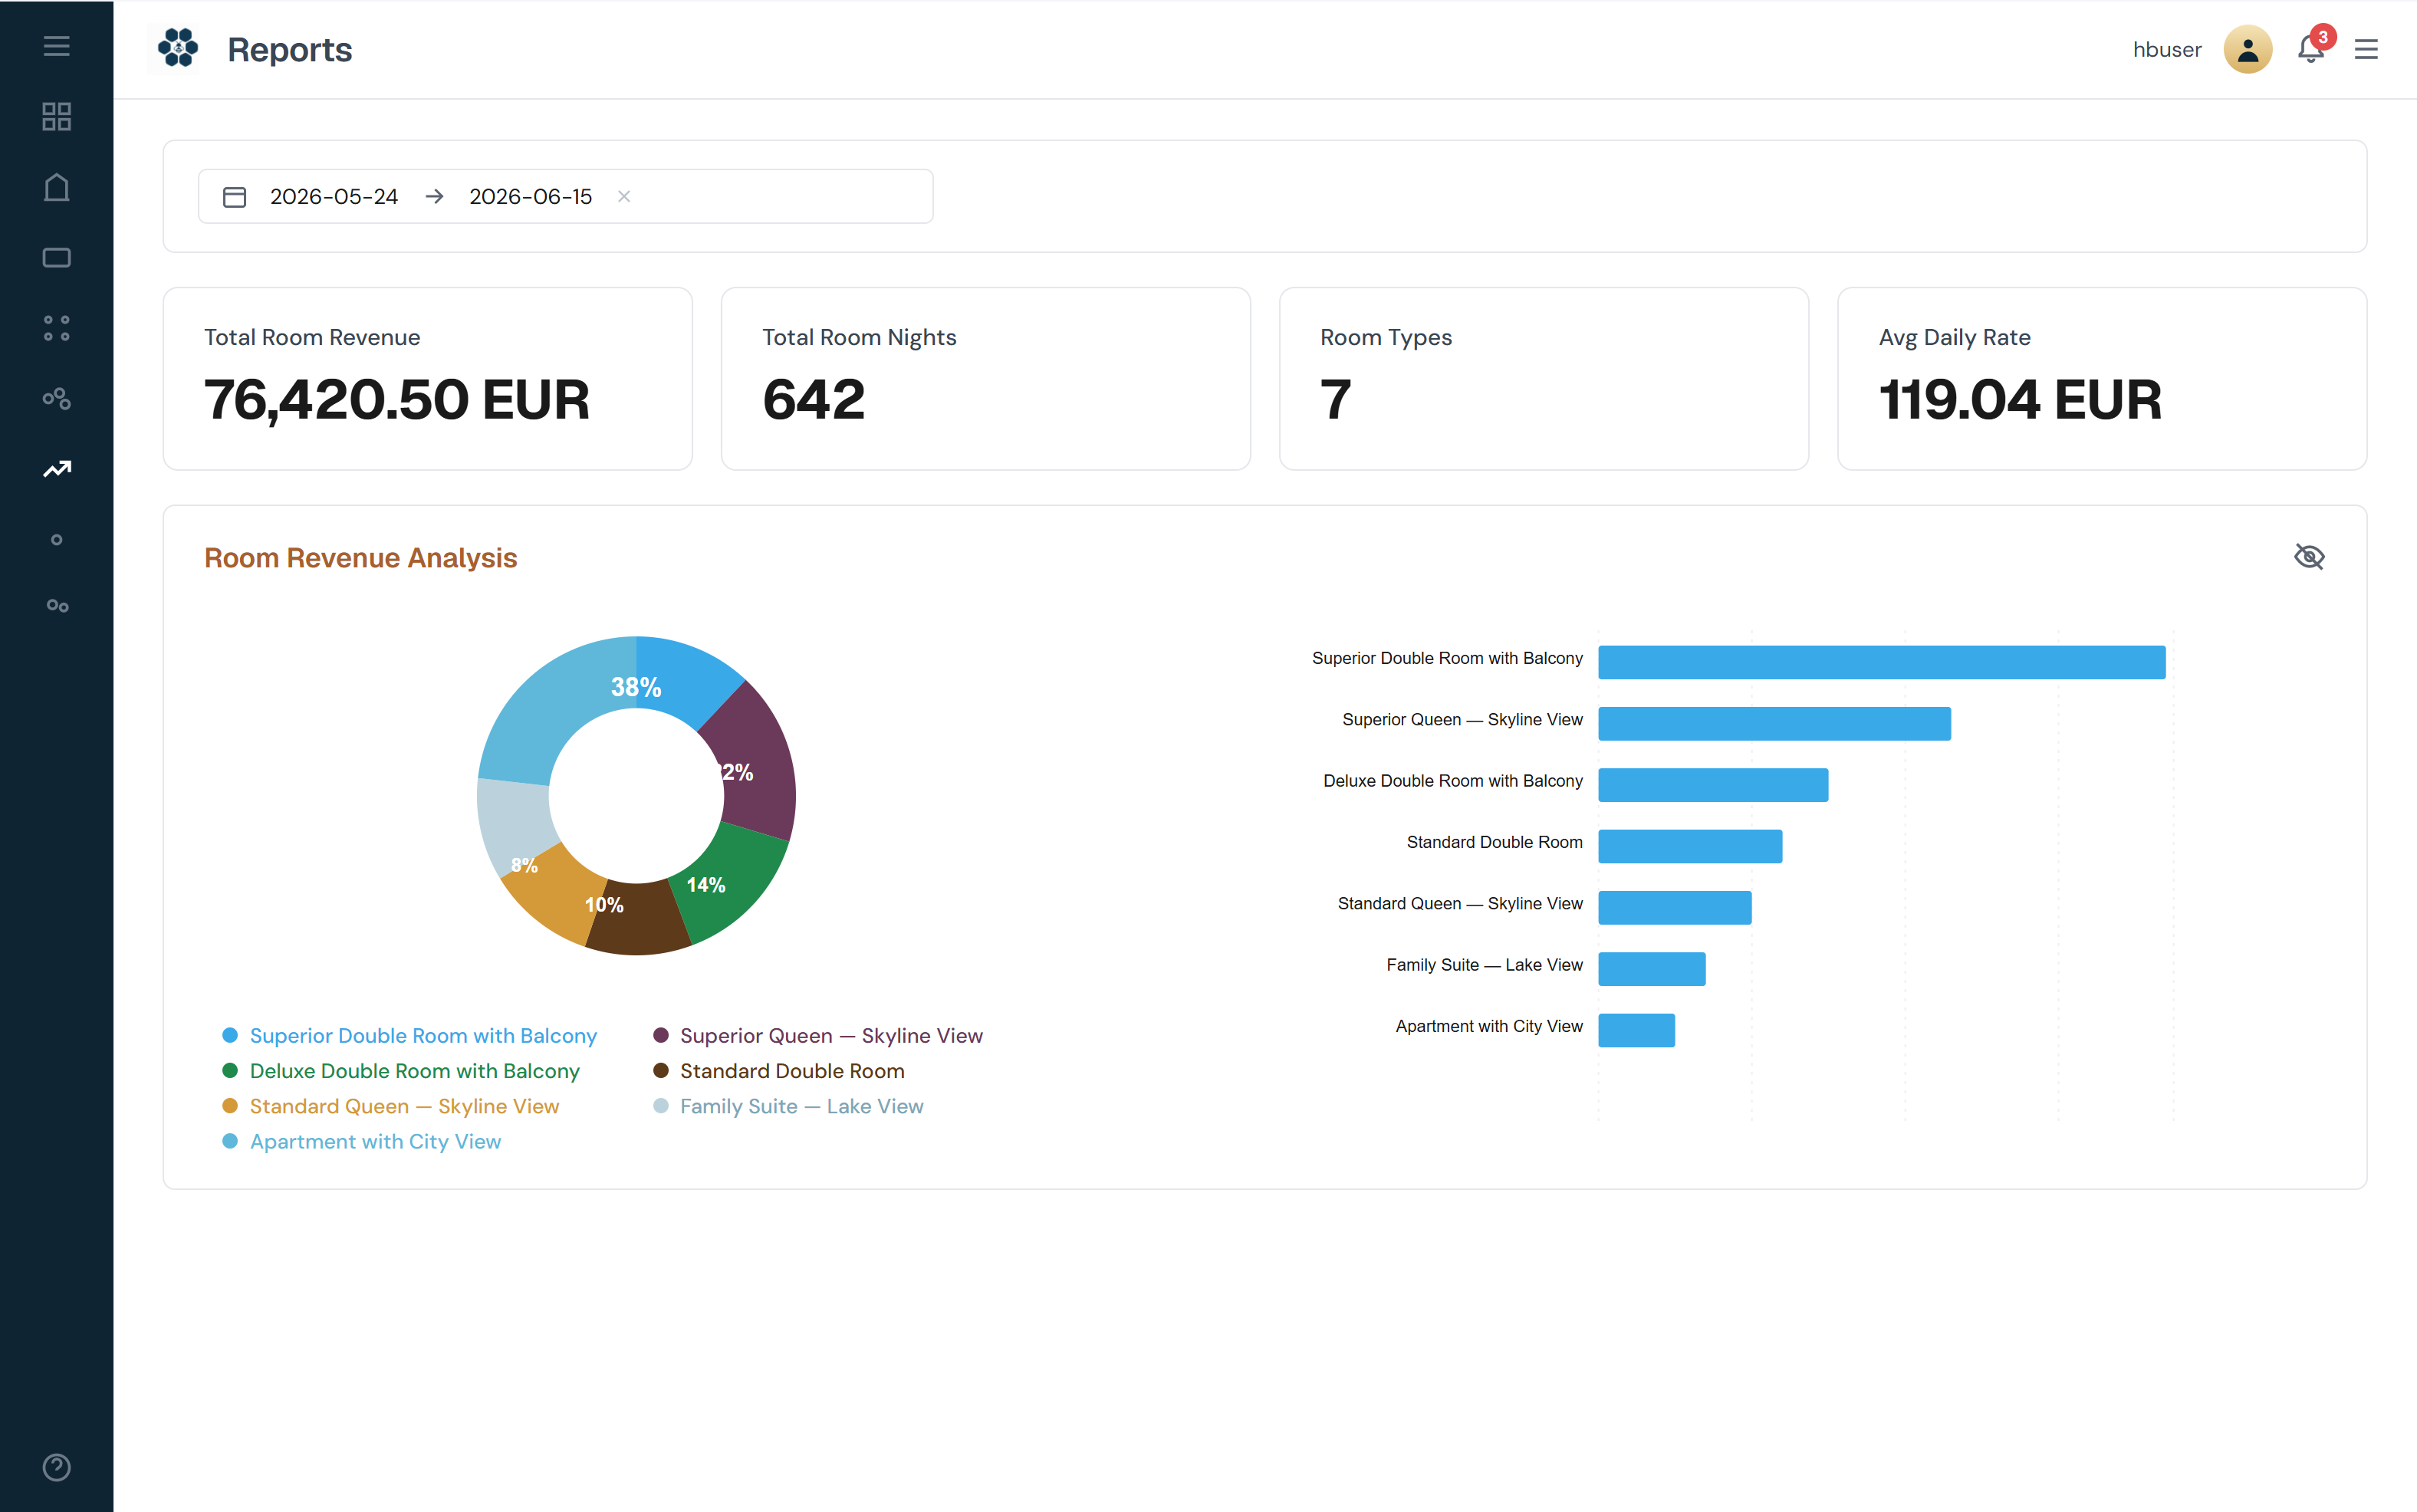
Të ardhurat sipas burimit, segmentit të tregut, planit tarifor dhe kanalit, me krahasim me periudha të mëparshme dhe me parashikimin tënd.
Ndërto një panel për rol (GM, Të ardhurat, F&B, Pronar), për pronë ose për pikë. Widget-e drag-and-drop, me parazgjedhje të arsyeshme nga fillimi.
Raporte flash ditore, përmbledhje performance javore, ekstrakte P&L mujore, të dërguara automatikisht me email te kutia e duhur në PDF, Excel ose CSV.
Krahaso çdo dritare kundër së njëjtës javë vitin e kaluar, muajin e kaluar ose parashikimin tënd, me tregues rëndësie ku lëvizja është e pazakontë.
Çdo raport mbështetet nga e njëjta magazinë që Bee AI do të përdorë, kur aktivizon AI, çdo panel bëhet një pyetje që mund të bësh.
Raportimi i mikpritjes është një histori për mënyrën si ndërveprojnë mysafirët, dhomat, ushqimi, pija, pagesat dhe njerëzit. Moduli i raportimit është ndërtuar rreth kësaj, çdo panel lexohet si një rrëfim, me krahasimet e duhura dhe kontekstin e duhur.
Zënia, ADR, RevPAR, GOPPAR, ALOS, marrja, të ardhurat F&B, përzierja e kanaleve, të gjitha në një ekran, të rifreskuara live. Klik çdo numër për të zbritur te transaksionet themelore, segmentin nga vinte dhe krahasimin periudhë-mbi-periudhë.
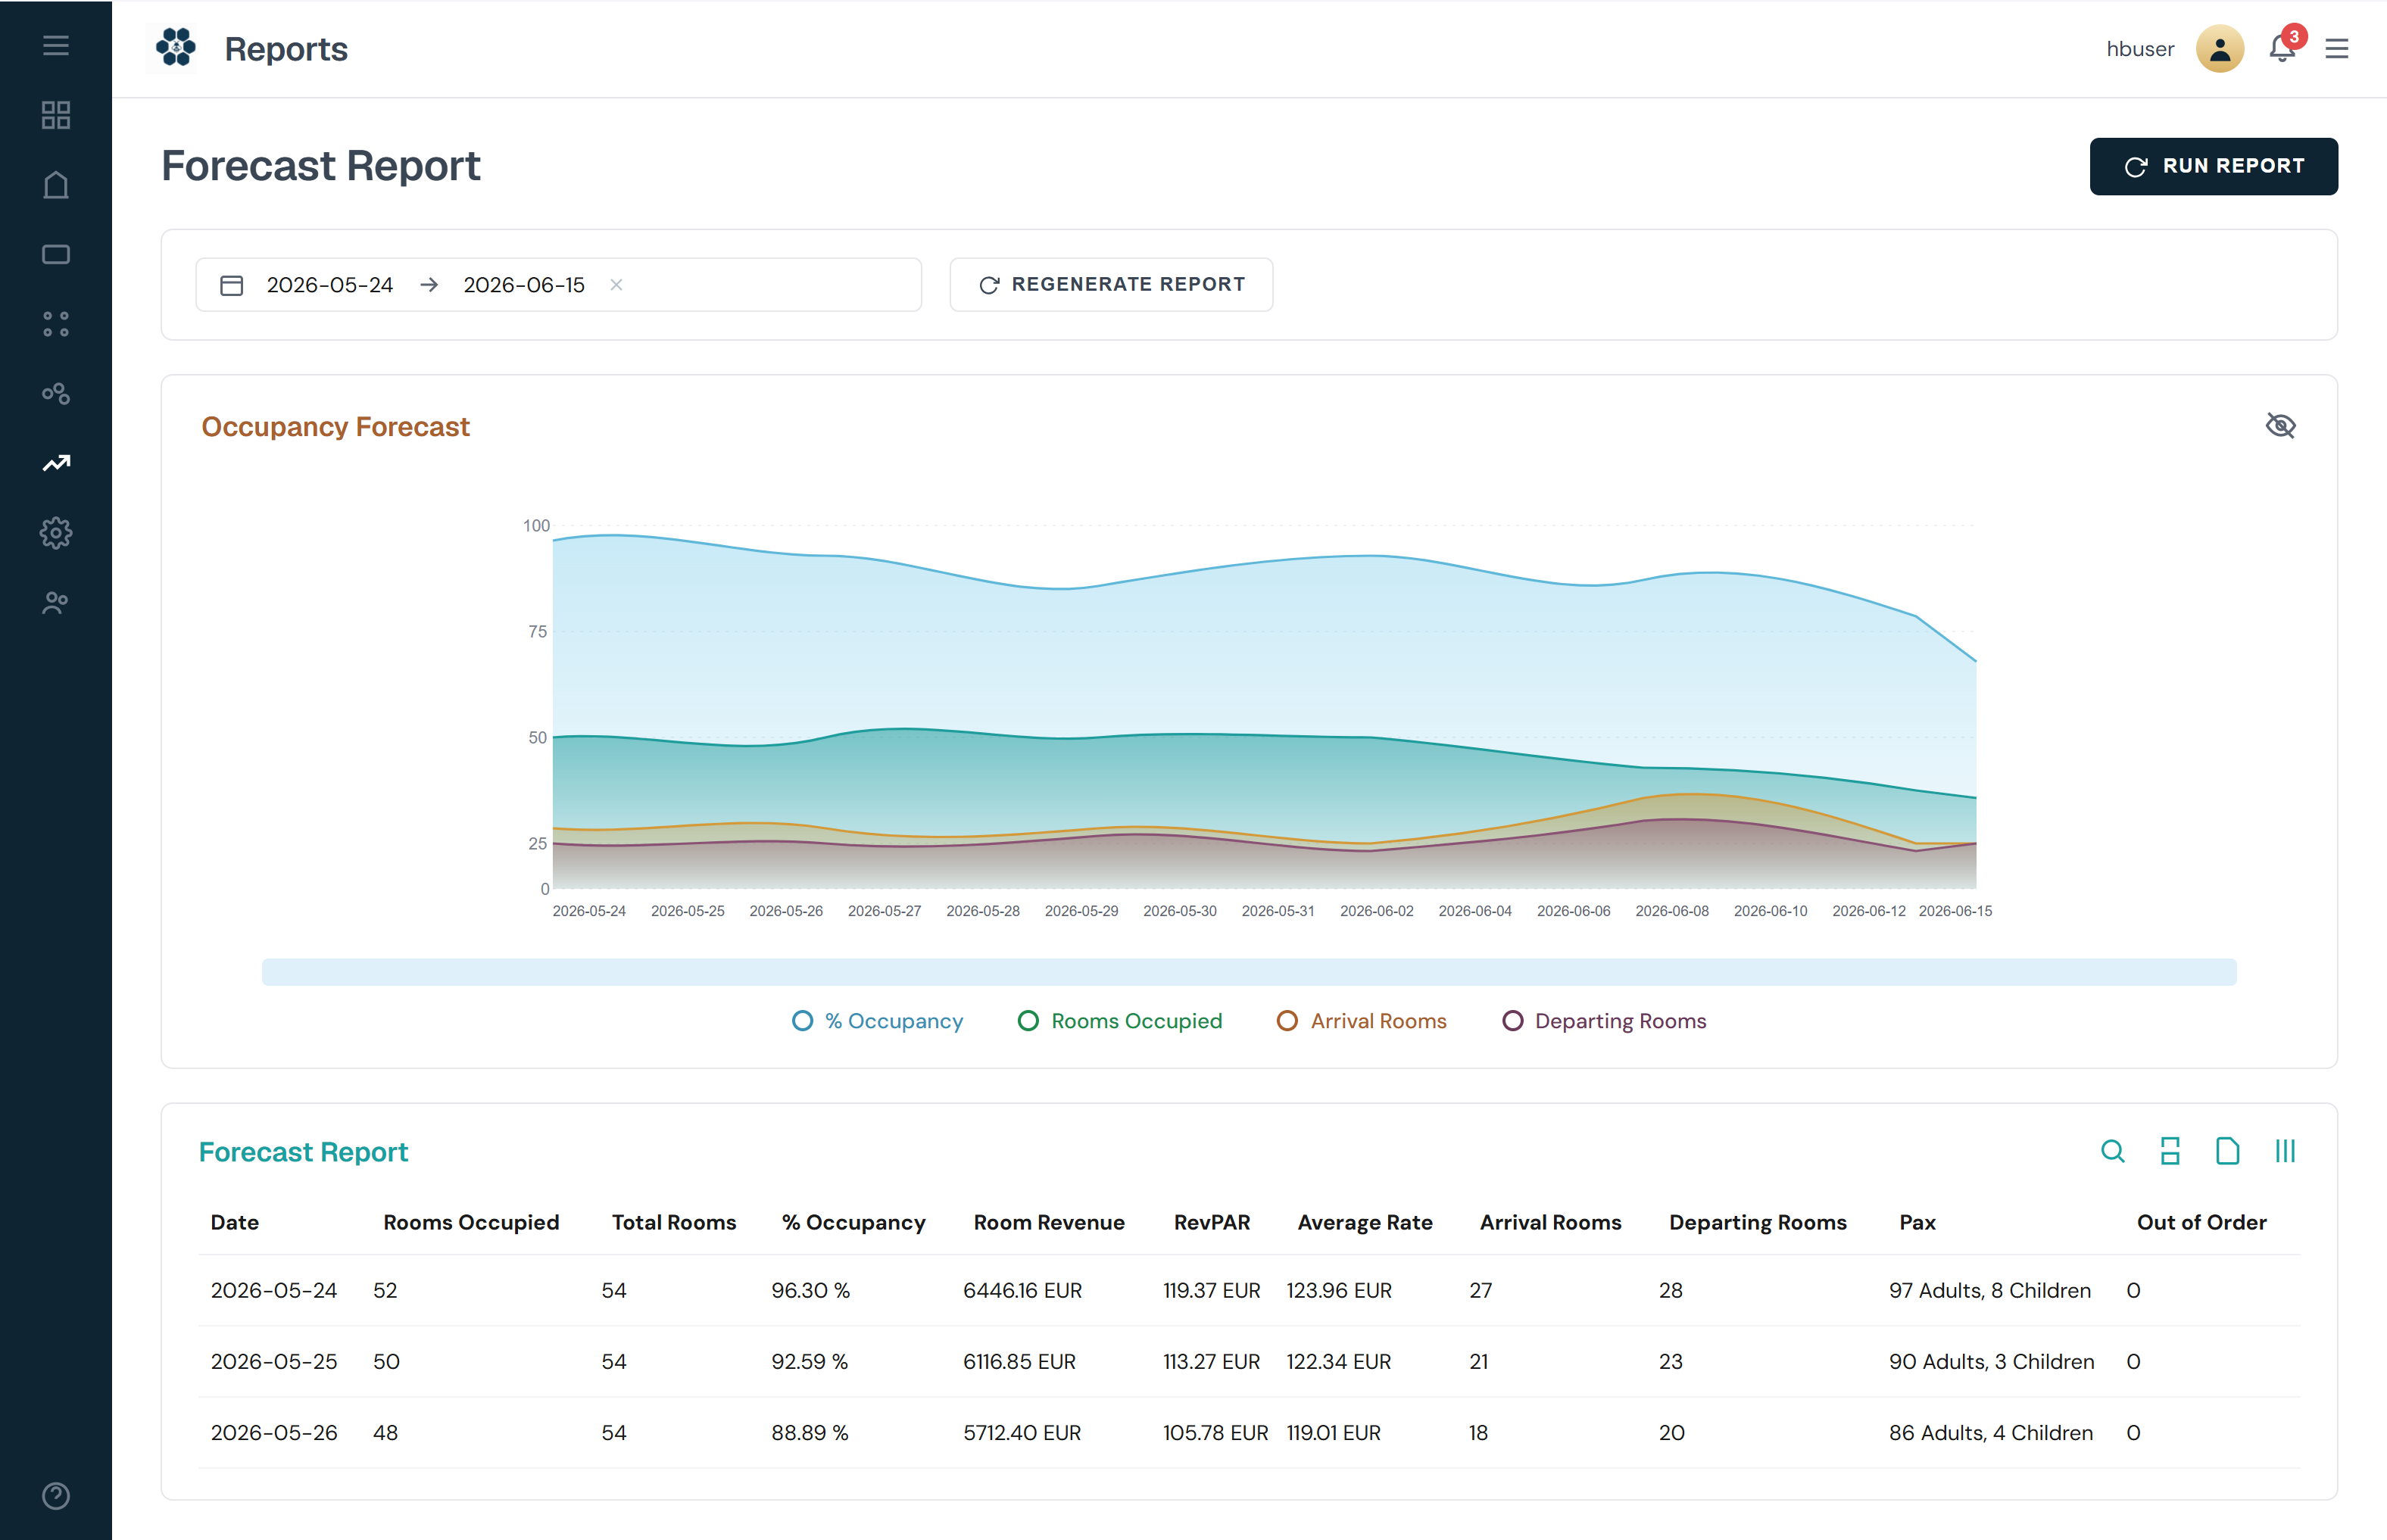
Një ndërtues raportesh drag-and-drop që tërheq nga e njëjta shtresë të dhënash si panelet live. Ndërto një raport një herë, ruaje si shabllon, ndaje me rolin e duhur dhe planifiko që të mbërrijë në kutinë e duhur në kohën e duhur.
Raport flash ditor në orën 7. Përmbledhje javore për pronarin të Hënave në 9. Ekstrakt P&L mujor në 1-shin. Të gjitha PDF ose Excel, të gjitha të markës, të gjitha të planifikuara. Dhe çdo raport është gjithashtu një lidhje live, që pronari që do numrin më të fundit të rifreskojë me një klik.
Raportimi është aq i mirë sa burimet dhe daljet e tij. Moduli i raportimit lexon nga çdo modul tjetër HotelBee dhe shtyn te kutitë, drive-et dhe mjetet BI që ekipi yt përdor tashmë.
Para HotelBee, GM-ja eksportonte pesë tabela Excel çdo të Hënë. Tani pronari merr një përmbledhje javore me një faqe në orën 9 të mëngjesit të Hënës, e auto-gjeneruar, çdo metrikë e klikueshme. Biseda lëvizi nga "çfarë ndodhi" në "çfarë bëjmë për këtë".
Raportimi është shtresa që e bën çdo modul tjetër të tregojë një histori. Modulet më poshtë ushqejnë të dhënat; Bee AI është ajo që i kthen ato në përgjigje.
Don't see your question? Talk to our team.
Të gjitha metrikat standarde të mikpritjes: zënia, ADR, RevPAR, GOPPAR, ALOS, marrja, të ardhurat totale, të ardhurat F&B, mbulimi mesatar, përzierja e kanaleve, përzierja e segmenteve, përzierja e burimit. Çdo metrikë është e klikueshme, zbres te transaksionet themelore me një prekje.
Po. Ndërtuesi i raporteve është drag-and-drop mbi të njëjtën shtresë të dhënash që fuqizon panelet live. Ndërto një raport një herë, ruaje si shabllon, ndaje me një rol dhe planifiko eksportin. Pa SQL të nevojshme, por një dalje SQL është e disponueshme për përdoruesit e avancuar.
Jo sot. Raportimi është panele, raporte të personalizuara dhe eksporte të planifikuara. Insights AI, parashikim dhe pyetje me gjuhë natyrore vijnë nëpërmjet Bee AI (aktualisht në listën e pritjes së aksesit të hershëm). Raportimi është ndërtuar mbi të njëjtën shtresë të dhënash që përdor Bee AI, kështu që je gati-AI kur ta aktivizosh.
Po, ditore, javore ose mujore, në PDF, Excel ose CSV, të markës me logon tënde. Marrësit mund të jenë një person, një rol ose një adresë email e jashtme. Çdo raport ka gjithashtu një lidhje live të ndashme me akses të bazuar në rol.
Po. Çdo grafik mbështet krahasim periudhë-mbi-periudhë, javë-mbi-javë, muaj-mbi-muaj, vit-mbi-vit, ose kundër parashikimit tënd. Flamujt e rëndësisë theksojnë lëvizjet e pazakonta që të mos i shikosh me sy.
Po. Ekspozojmë një API vetëm-lexim të dhënash që Power BI, Looker Studio dhe mjete të tjera BI mund të lidhen. Për shumicën e pronave raportimi i integruar mjafton, por për grupet me një magazinë qendrore të dhënash API-ja e bën integrimin të drejtpërdrejtë.
Plan falas i disponueshëm. Pa kartë krediti. Ndërto panelin tënd të parë në më pak se dhjetë minuta.