Live KPI dashboards
Occupancy, ADR, RevPAR, GOPPAR, ALOS, pickup, F&B revenue, average cover, refreshed live as the platform records each transaction.
Live KPIs across the whole property, occupancy, ADR, RevPAR, F&B revenue, segment mix, channel mix, pickup curves. Build custom dashboards, schedule exports, and stay ready for the day Bee AI starts answering questions about all of it.
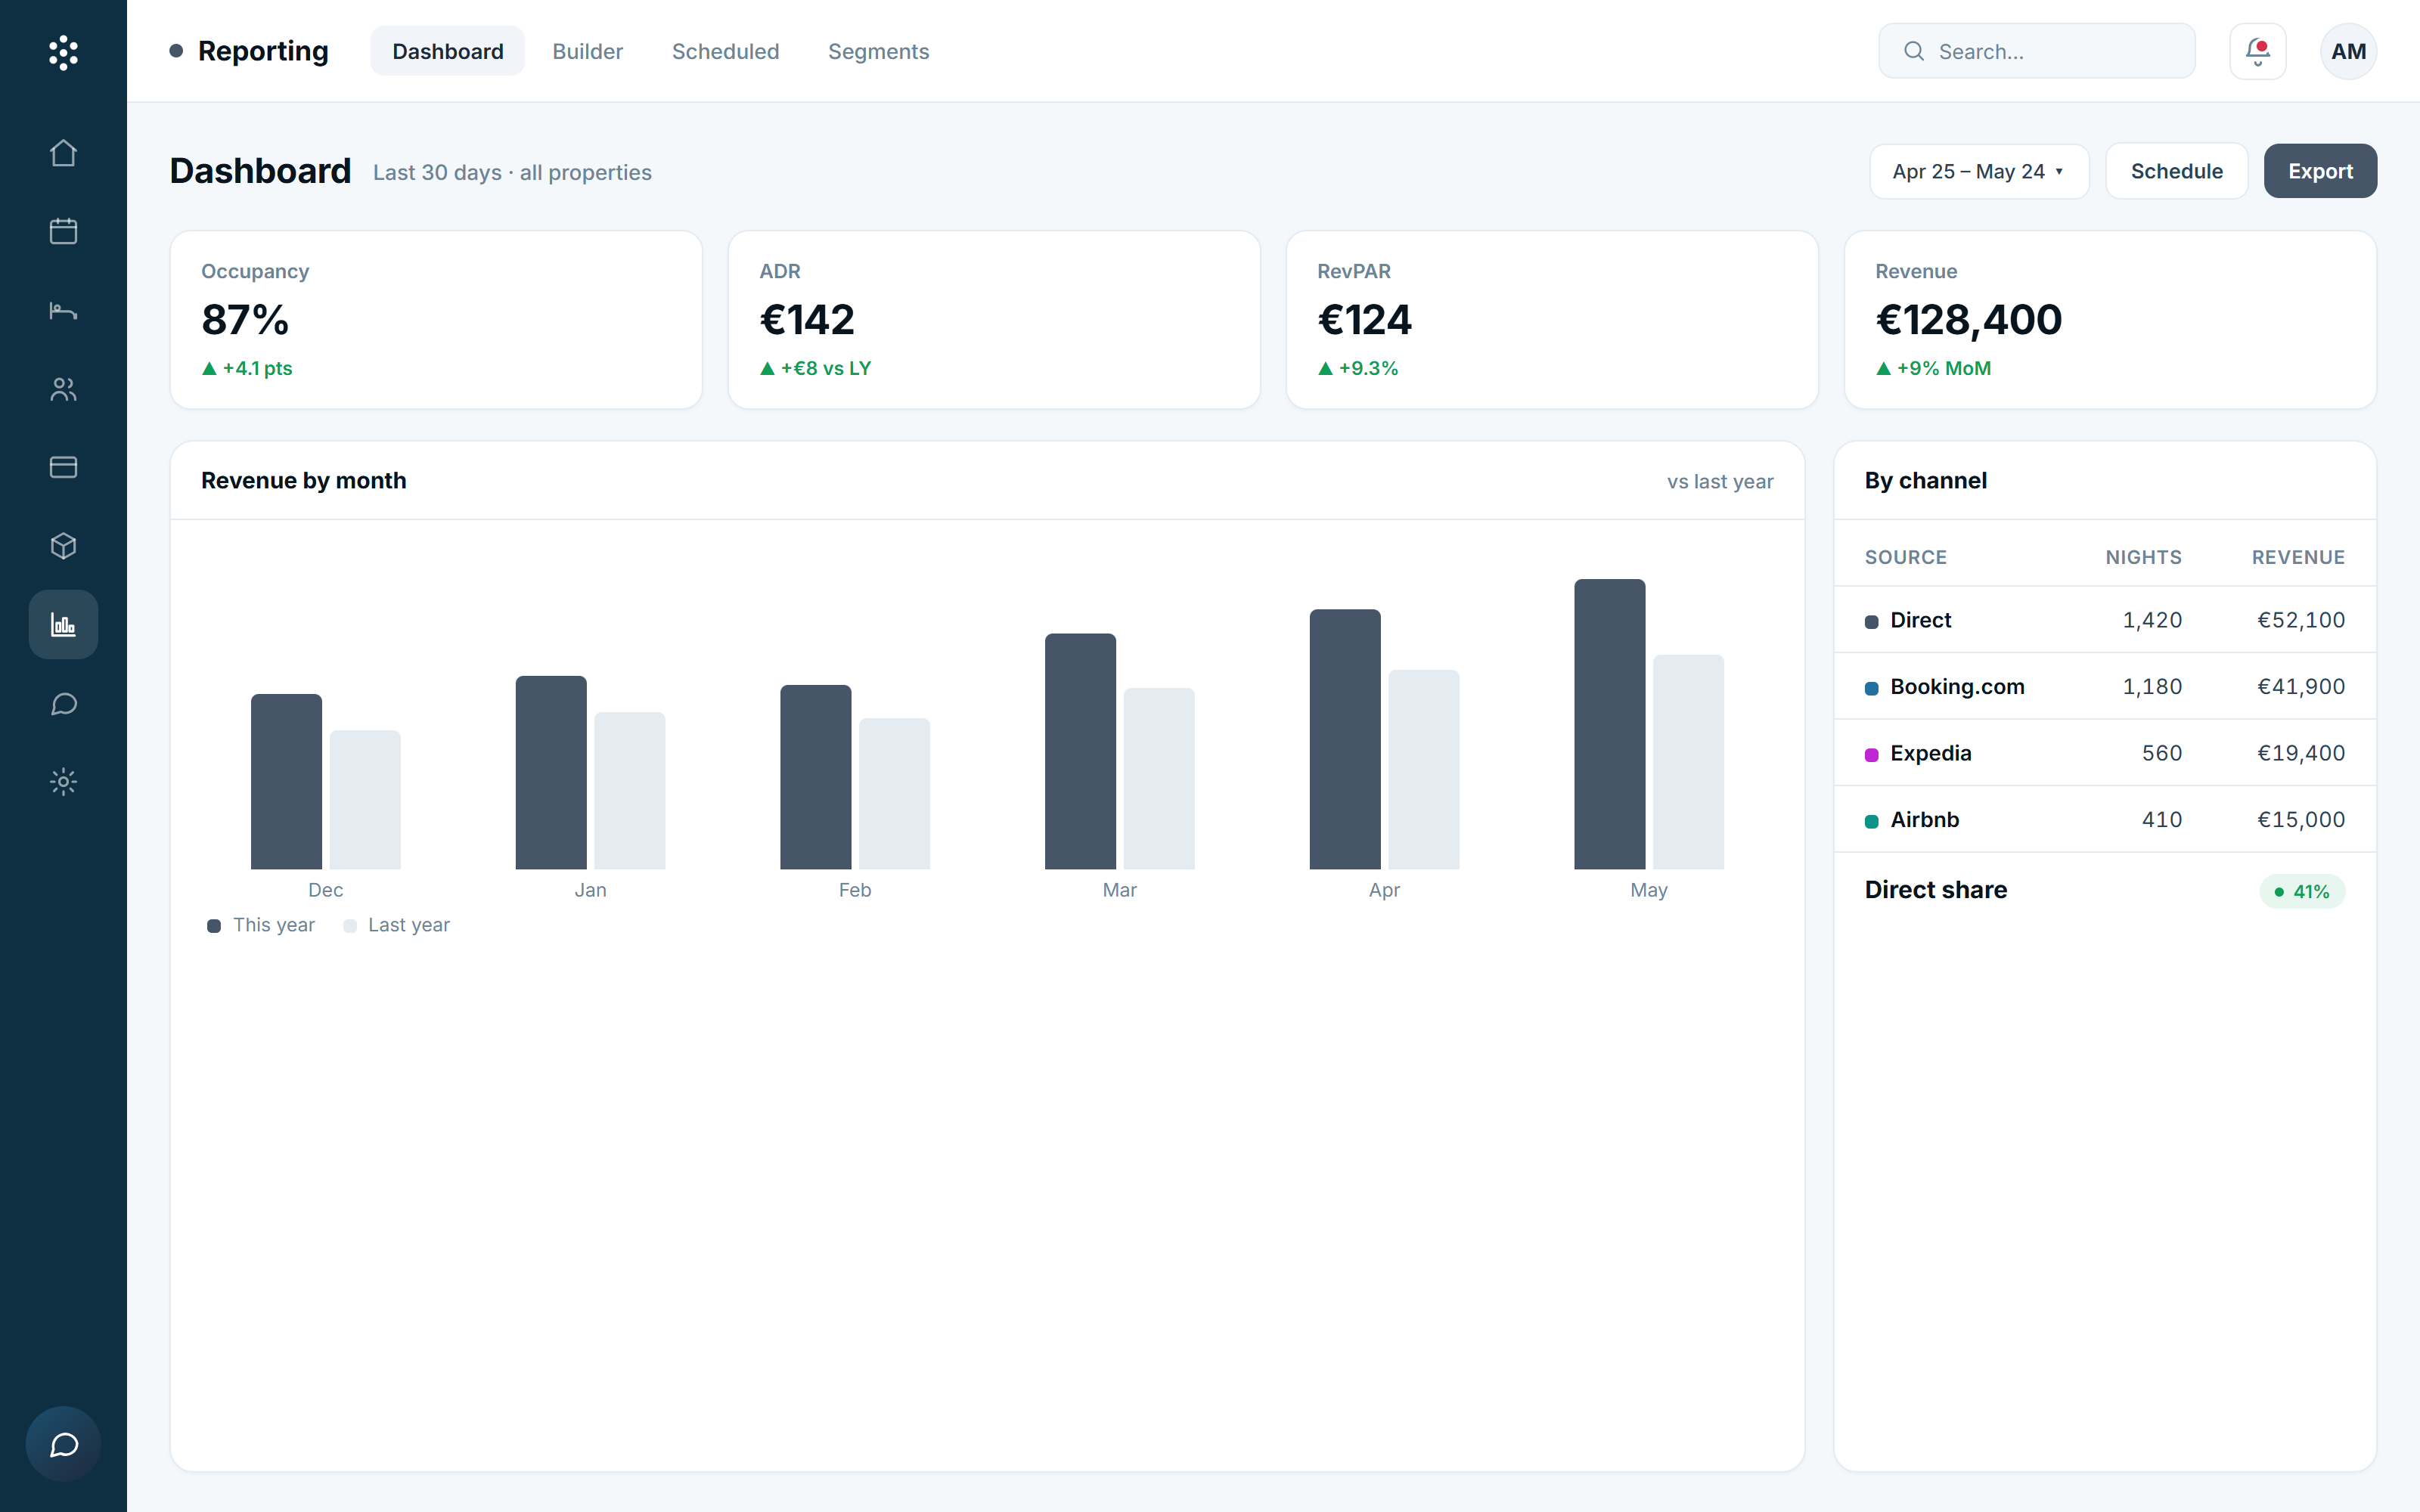
Built for the operator who needs the right number at 8 AM, the right export at 5 PM, and the right narrative for the owner on Monday. Live, custom, scheduled, and AI-ready when you are.
Occupancy, ADR, RevPAR, GOPPAR, ALOS, pickup, F&B revenue, average cover, refreshed live as the platform records each transaction.
Revenue by source, market segment, rate plan and channel, with comparison to previous periods and to your own forecast.
Build a dashboard per role (GM, Revenue, F&B, Owner), per property, or per outlet. Drag-and-drop widgets, with sensible defaults from the start.
Daily flash reports, weekly performance digests, monthly P&L extracts, emailed automatically to the right inbox in PDF, Excel or CSV.
Compare any window against the same week last year, last month, or your forecast, with significance indicators where the move is unusual.
Every report is backed by the same warehouse Bee AI will use, when you turn AI on, every dashboard becomes a question you can ask.
Hospitality reporting is a story about how guests, rooms, food, drink, payments and people interact. The reporting module is built around that, every dashboard reads as a narrative, with the right comparisons and the right context.
Occupancy, ADR, RevPAR, GOPPAR, ALOS, pickup, F&B revenue, channel mix, all on one screen, refreshed live. Click any number to drill into the underlying transactions, the segment it came from, and the period-over-period comparison.
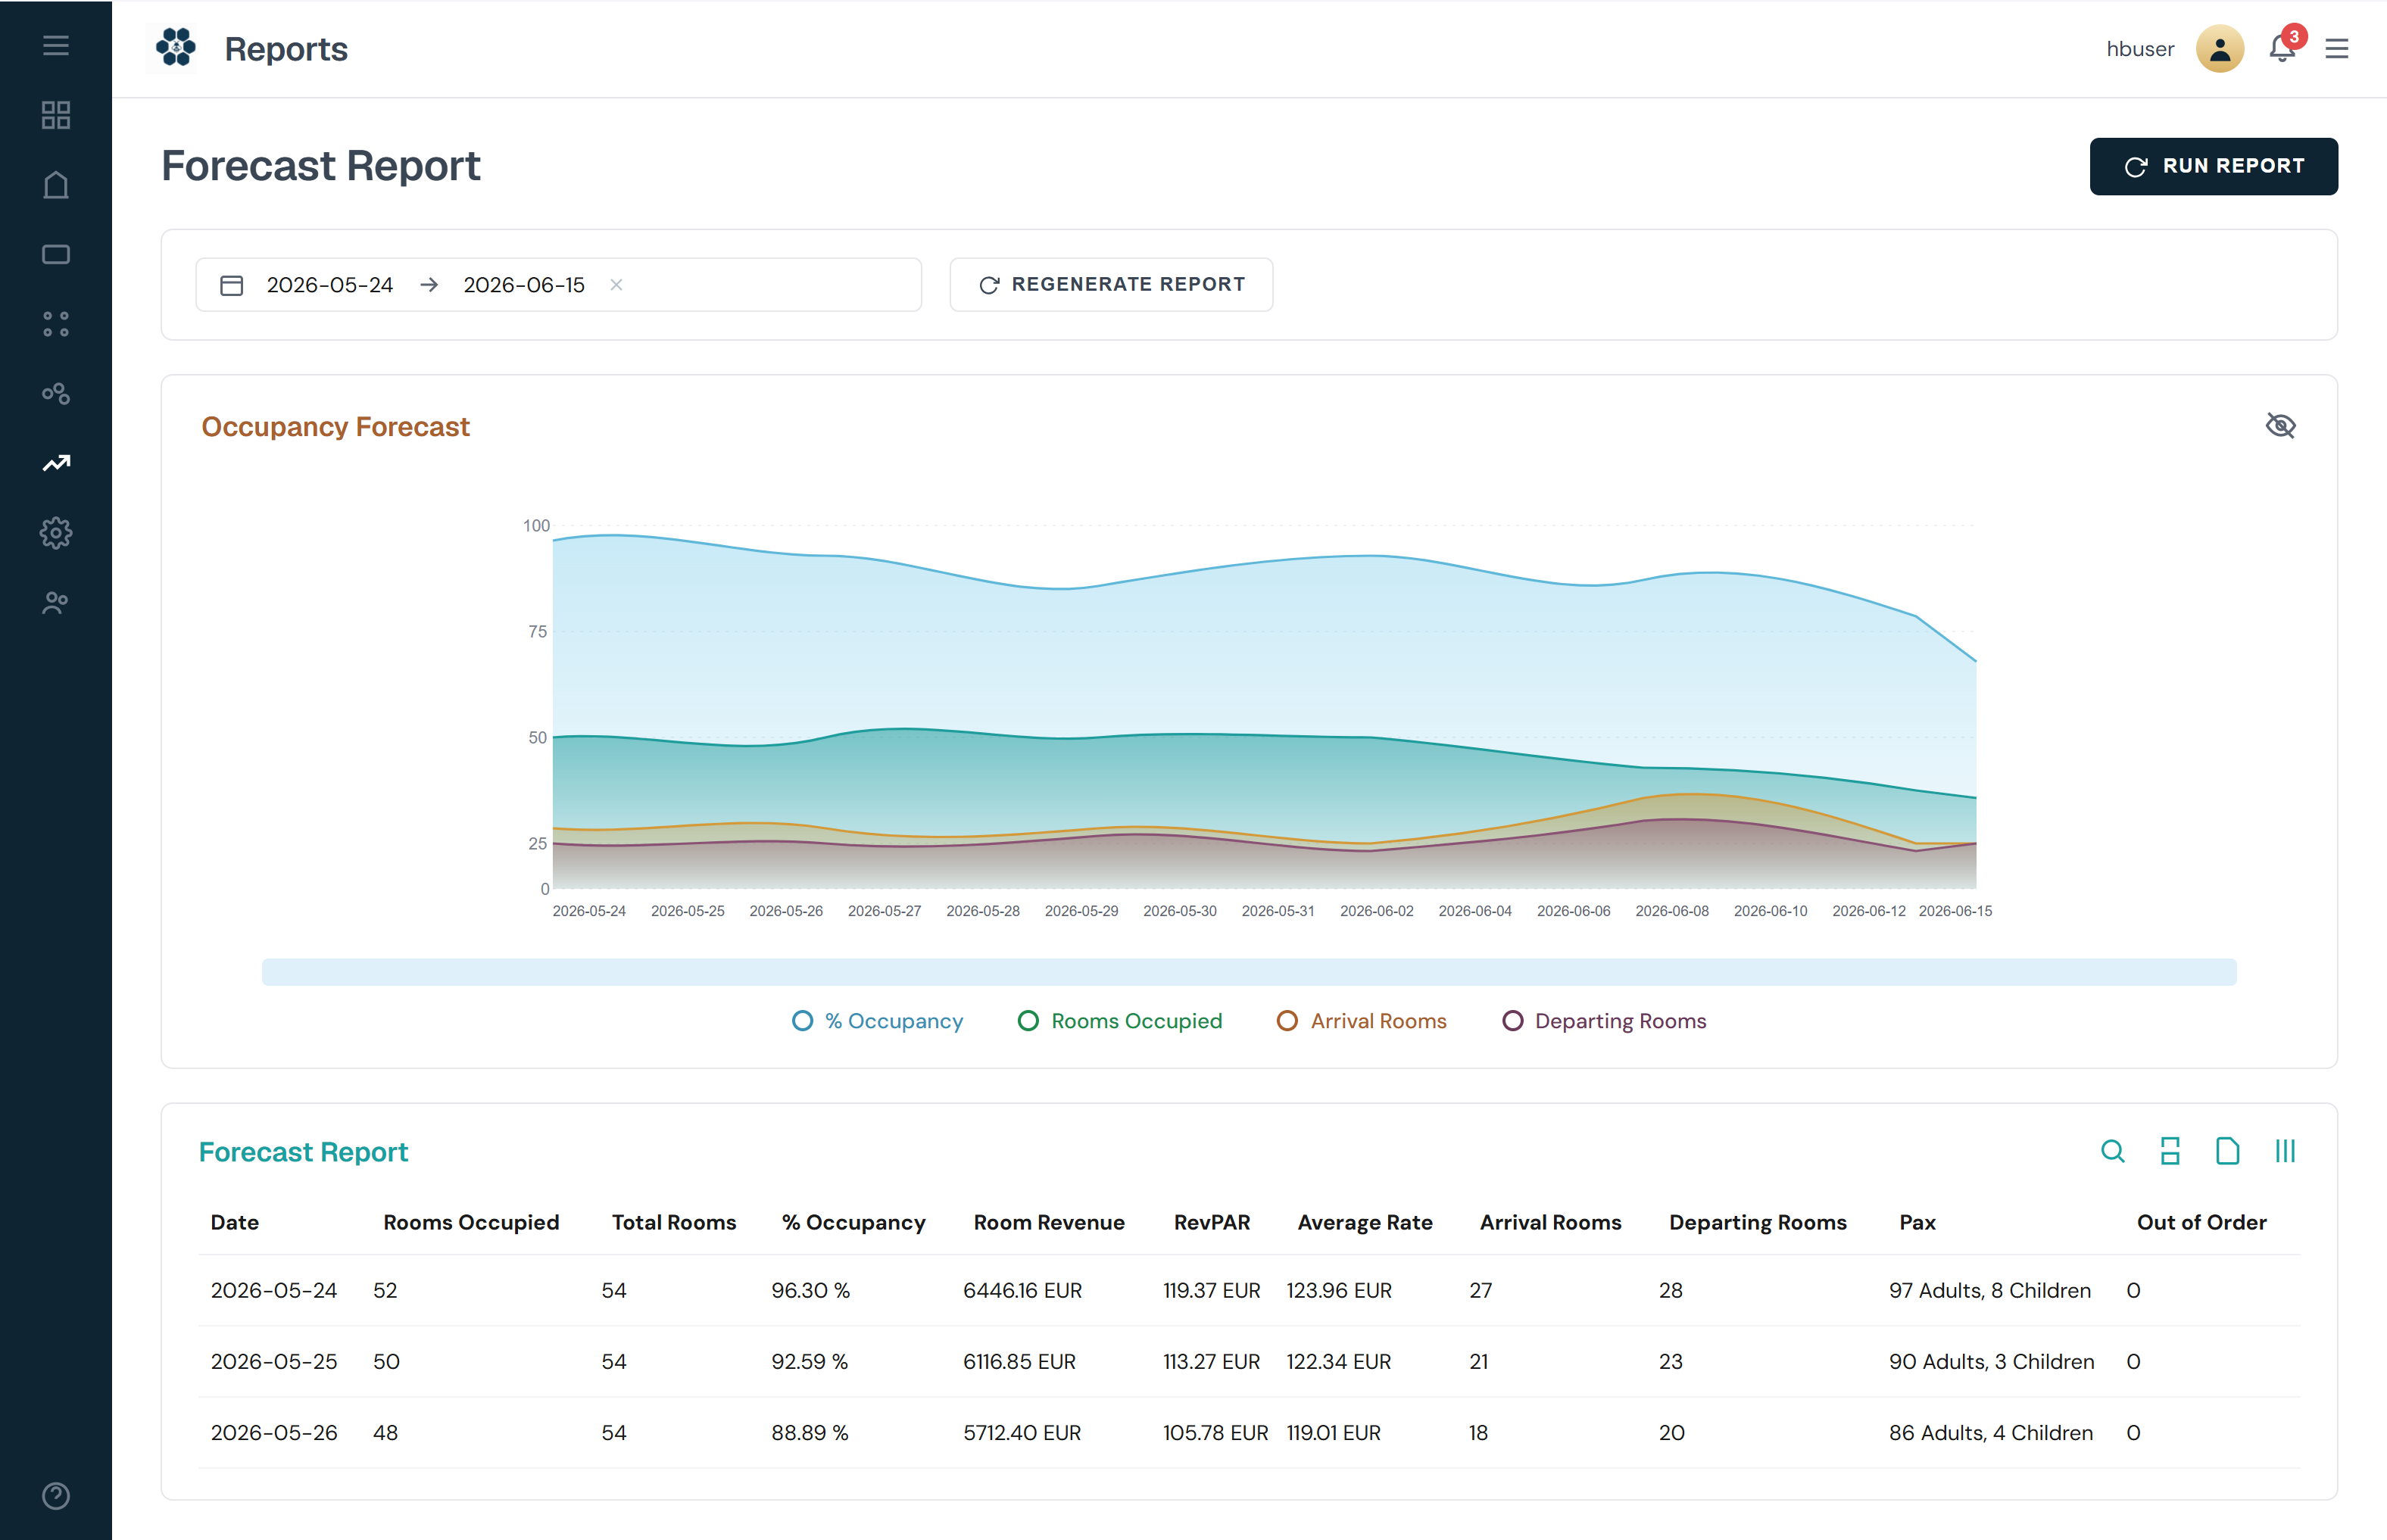
A drag-and-drop report builder that pulls from the same data layer as the live dashboards. Build a report once, save it as a template, share it with the right role, and schedule it to land in the right inbox at the right time.
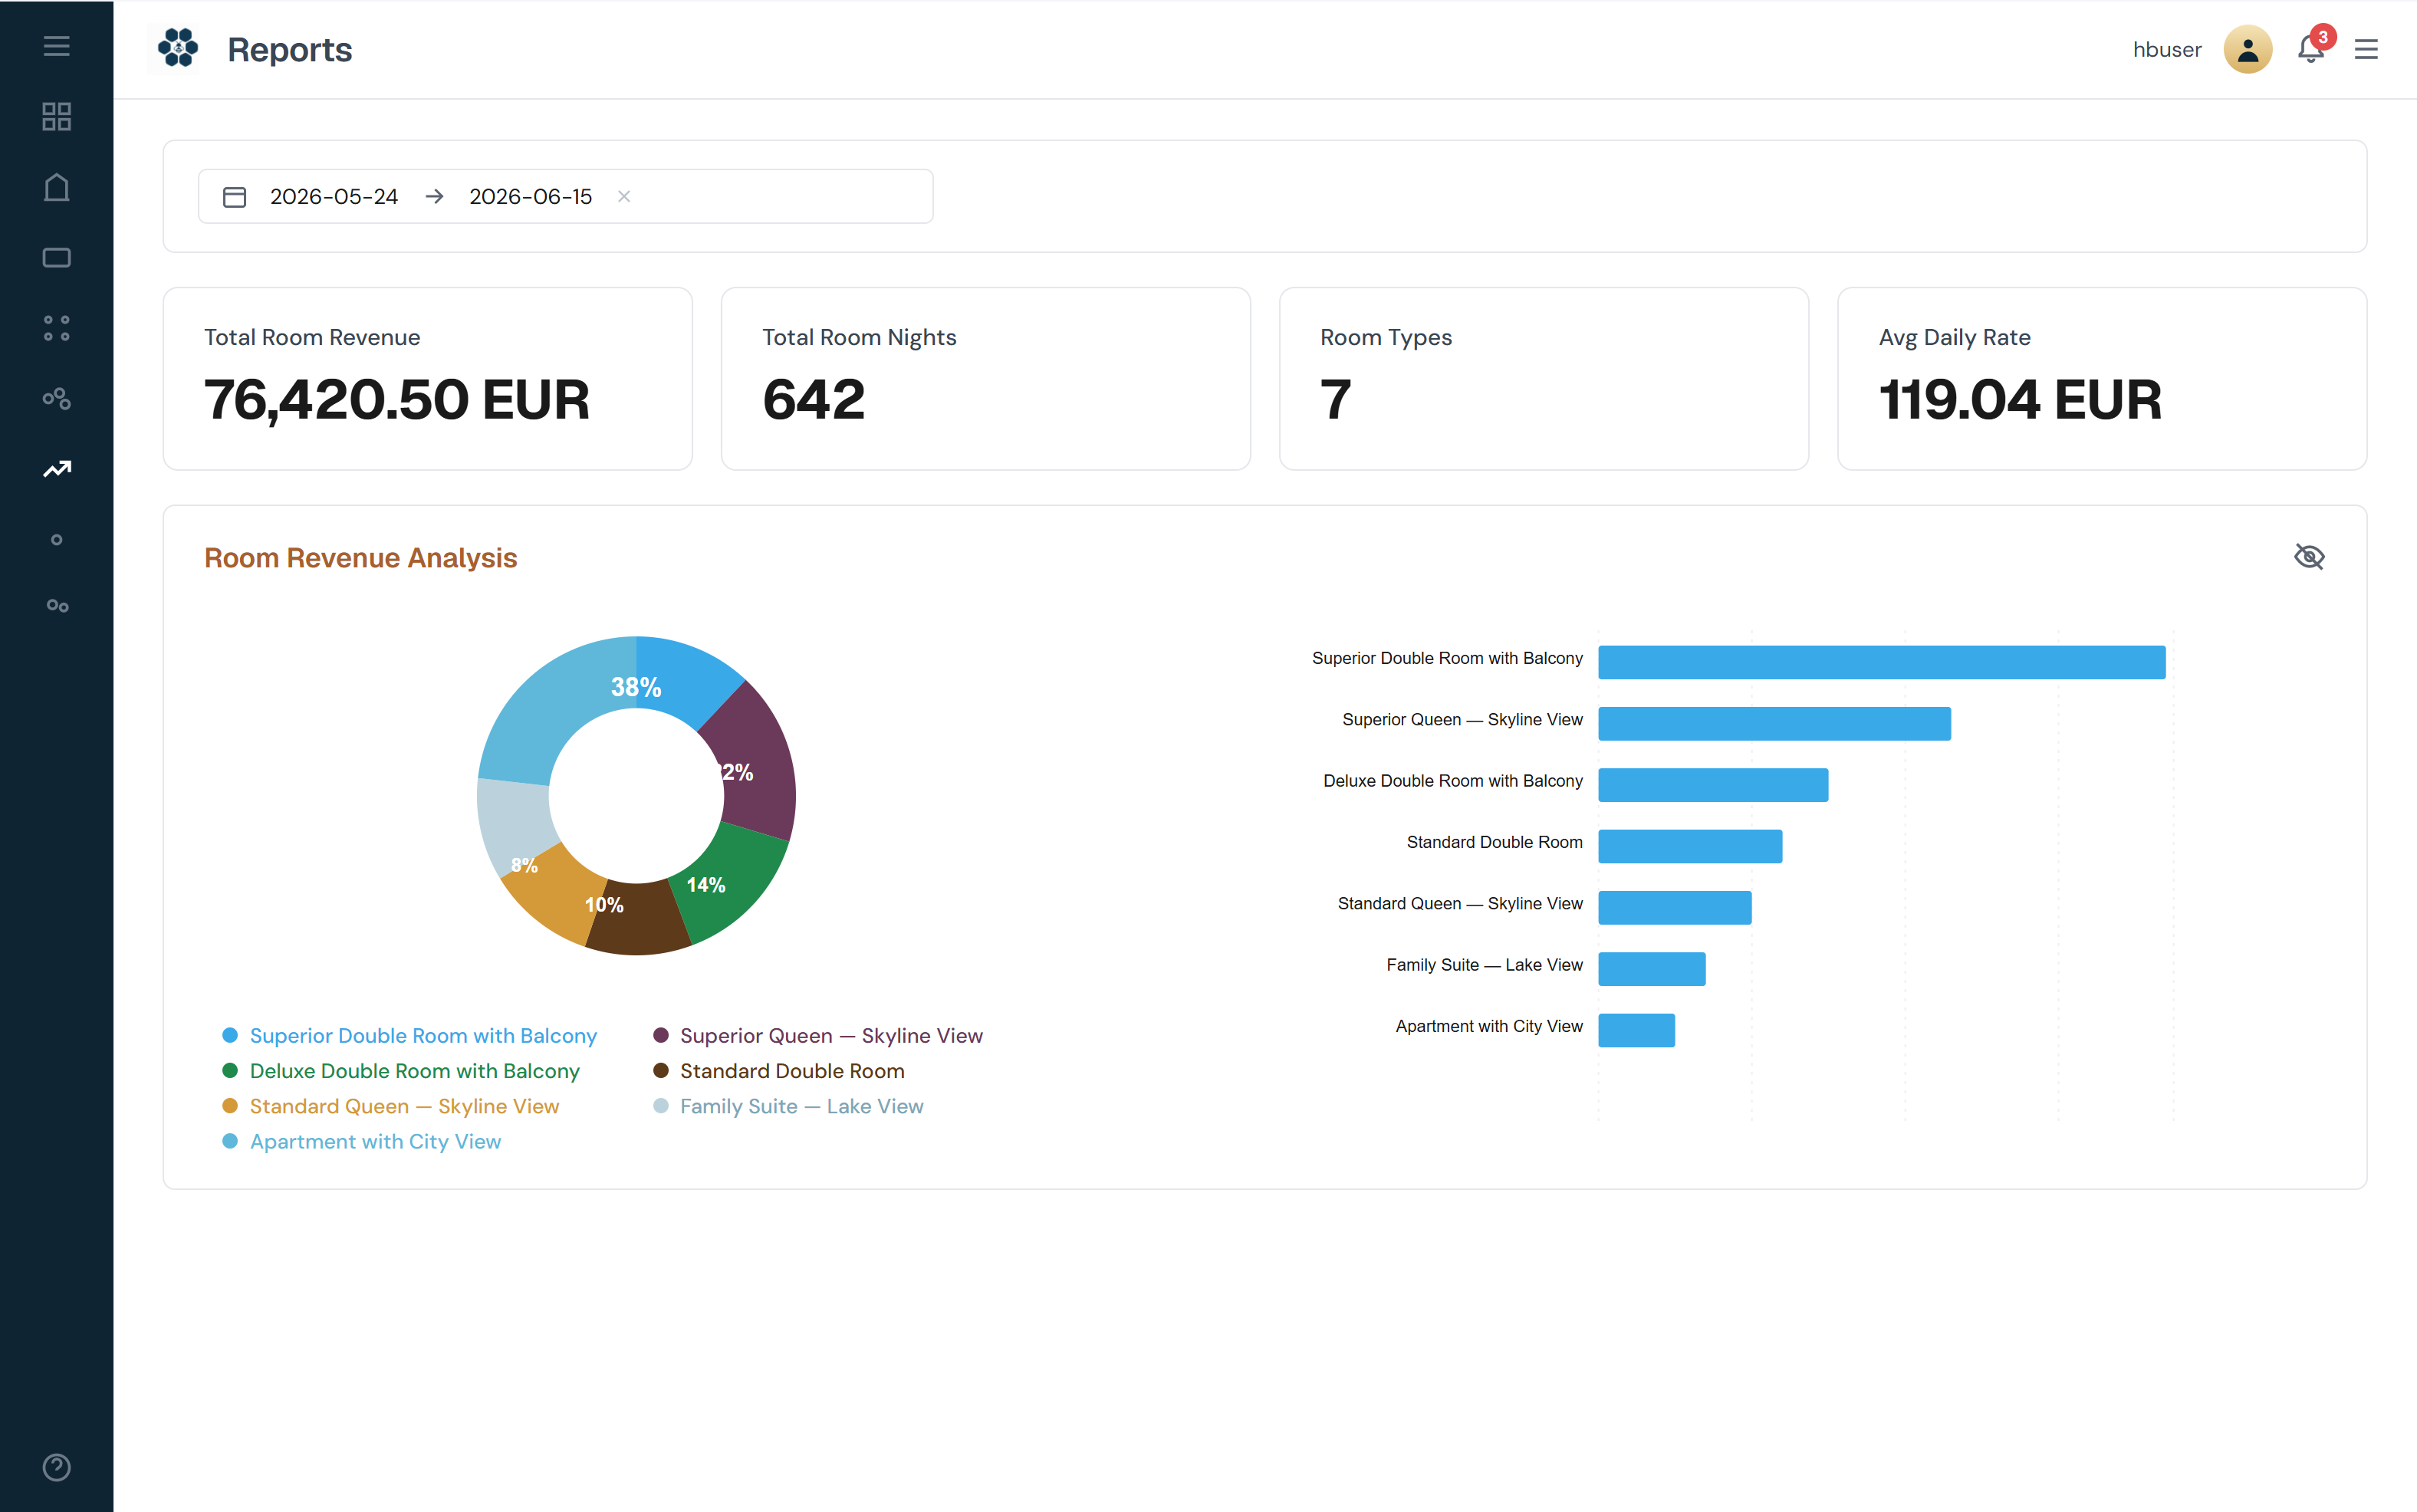
Daily flash report at 7 AM. Weekly owner digest on Mondays at 9. Monthly P&L extract on the 1st. All PDF or Excel, all branded, all scheduled. And every report is also a live link, so the owner who wants the latest number can refresh in one click.
Reporting is only as good as its sources and its outputs. The reporting module reads from every other HotelBee module and pushes to the inboxes, drives and BI tools your team already uses.
Before HotelBee, the GM exported five spreadsheets every Monday. Now the owner gets a one-page weekly digest at 9 AM Monday, auto-generated, every metric clickable. The conversation moved from "what happened" to "what do we do about it".
Reporting is the layer that makes every other module tell a story. The modules below feed the data; Bee AI is what turns it into answers.
All the standard hospitality metrics: occupancy, ADR, RevPAR, GOPPAR, ALOS, pickup, total revenue, F&B revenue, average cover, channel mix, segment mix, source mix. Every metric is clickable, drill into the underlying transactions in one tap.
Yes. The report builder is drag-and-drop over the same data layer that powers the live dashboards. Build a report once, save as template, share with a role, and schedule the export. No SQL required, but a SQL escape hatch is available for advanced users.
Not today. Reporting is dashboards, custom reports, and scheduled exports. AI insights, forecasting and natural-language Q&A come via Bee AI (currently in early-access waitlist). Reporting is built on the same data layer Bee AI uses, so you are AI-ready when you turn it on.
Yes, daily, weekly or monthly, in PDF, Excel or CSV, branded with your logo. Recipients can be a person, a role, or an external email address. Each report also has a live shareable link with role-based access.
Yes. Every chart supports period-over-period comparison, week-over-week, month-over-month, year-over-year, or against your own forecast. Significance flags highlight unusual moves so you do not have to spot them by eye.
Yes. We expose a read-only data API that Power BI, Looker Studio and other BI tools can connect to. For most properties the built-in reporting is enough, but for groups with a central data warehouse the API makes integration straightforward.
Free plan available. No credit card required. Build your first dashboard in under ten minutes.